Reporting & Excels
The Report tab brings together the results from all areas in a project. It has two main sections:
- Summary — provides an overview of coverage and detector layouts across the project, with options to export the data to Excel.
- Report — creates the project report as a Word document.
Project status, saved views and comments are covered separately in Project Status, Views & Comments.
Before You Start
The summary is based exclusively on the Preliminary and Final configurations.
For every mapping in each area, you must designate one Preliminary configuration and one Final configuration. For example, if an area contains both Gas Mapping and Fire Mapping, each mapping must have its own Preliminary and Final configuration.
For more information, see Preliminary and Final.
Both configurations must also have been calculated before their results can appear in the summary. See Running Calculations.
WARNING
If a mapping does not have a Preliminary or Final configuration assigned, the summary displays No configuration set.
Make sure you designate both configurations for every mapping in every area before reviewing or exporting the project summary.
Summary
Open the Report tab. The Summary section is displayed by default.
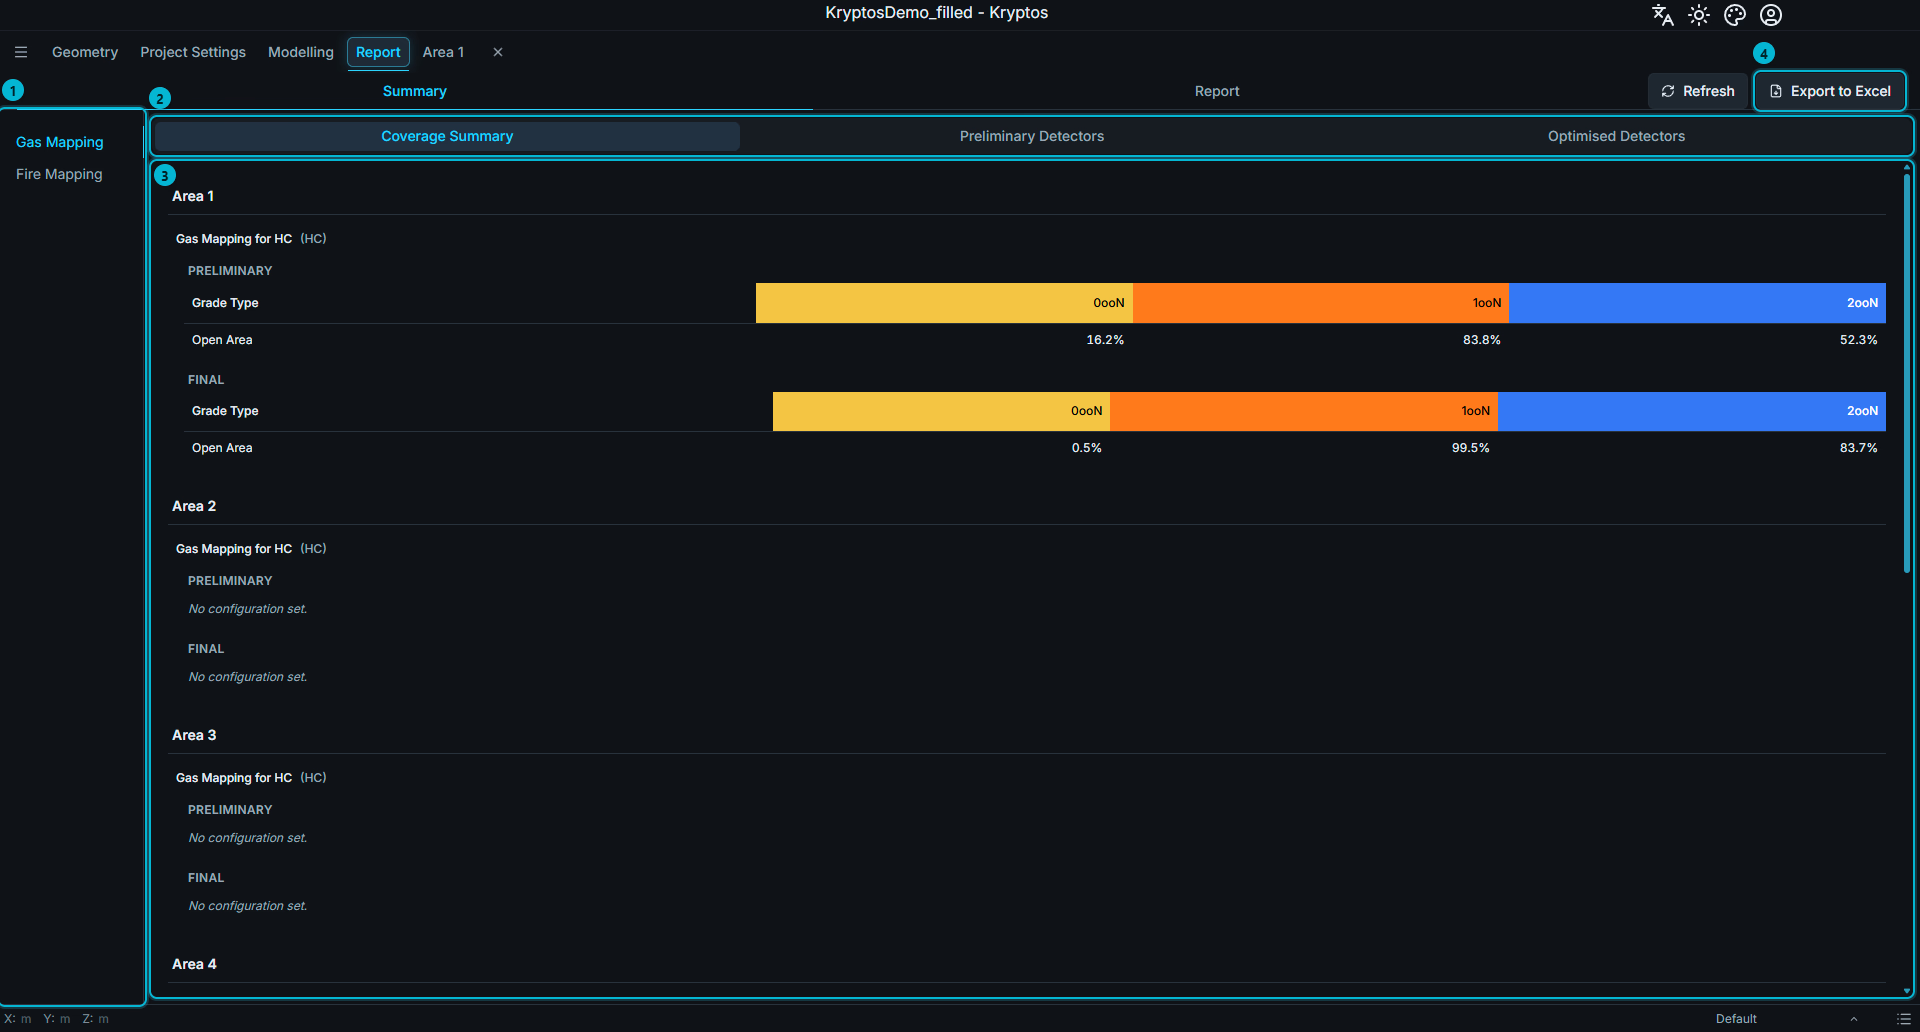
The Summary interface contains the following elements:
- Mapping — switches between Gas Mapping and Fire Mapping. The summary displays one mapping type at a time.
- Sub-tabs — provides access to Coverage Summary, Preliminary Detectors and Optimised Detectors.
- Coverage Summary — displays the coverage achieved in each area, for both Preliminary and Final configurations.
- Export to Excel — exports the project summary to an Excel workbook.
Coverage Summary
The Coverage Summary is organised by area. Each area lists its mappings of the selected type, with separate tables for the Preliminary and Final configurations:
- Preliminary — displays the coverage results for the mapping's Preliminary configuration.
- Final — displays the coverage results for the mapping's Final configuration.
Each table contains one row for every grade type and a separate column for each voting logic. This allows you to compare the Preliminary and Final coverage side by side.
Preliminary Detectors
The Preliminary Detectors tab lists all detectors belonging to the Preliminary configurations, organised by area.
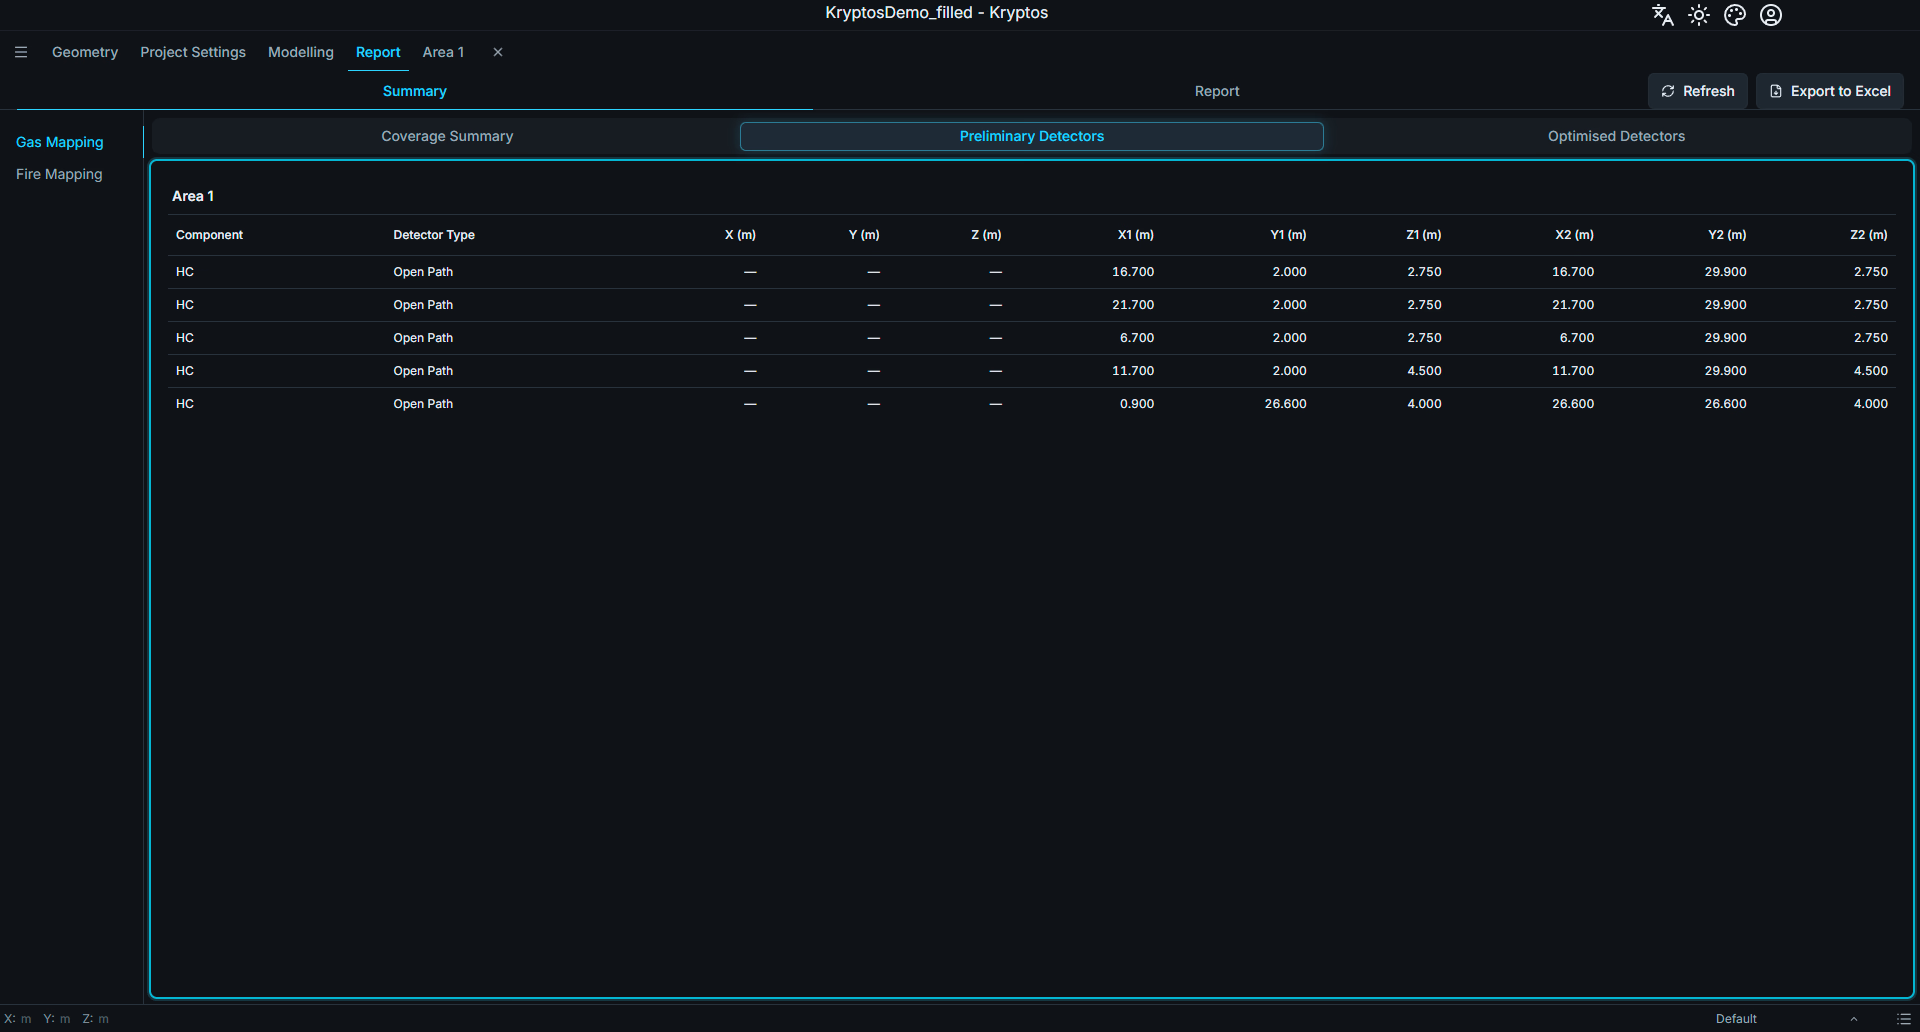
This provides an overview of the initial detector layouts across the project.
Optimised Detectors
The Optimised Detectors tab lists all detectors belonging to the Final configurations, organised by area.
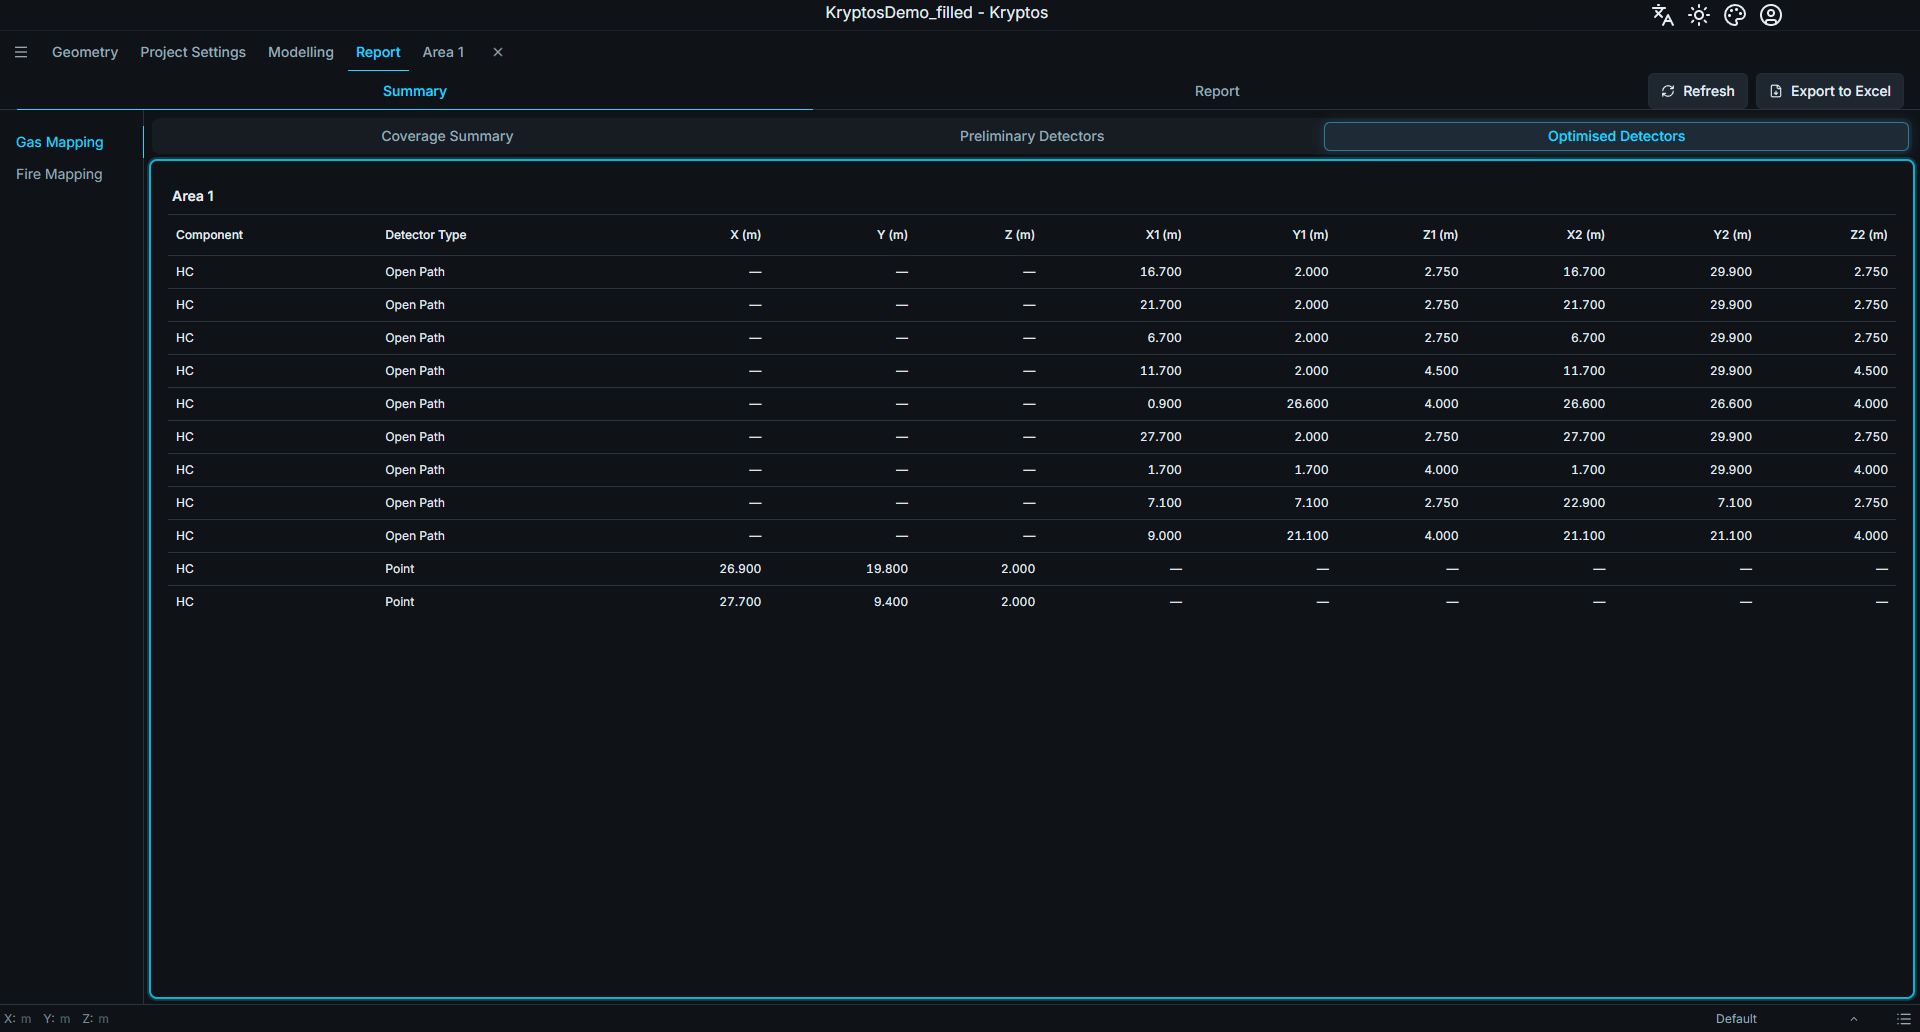
This provides an overview of the final, optimised detector layouts intended for delivery.
Gas and Fire
Use Gas Mapping and Fire Mapping on the left to switch between the two mapping types.
Both mapping types provide the same three sub-tabs:
- Coverage Summary
- Preliminary Detectors
- Optimised Detectors
The information displayed and the table columns vary according to the selected mapping type.
For example:
- Gas detectors — include details such as the detector component and type.
- Fire detectors — include details such as detector tilt, field of view and curvature.
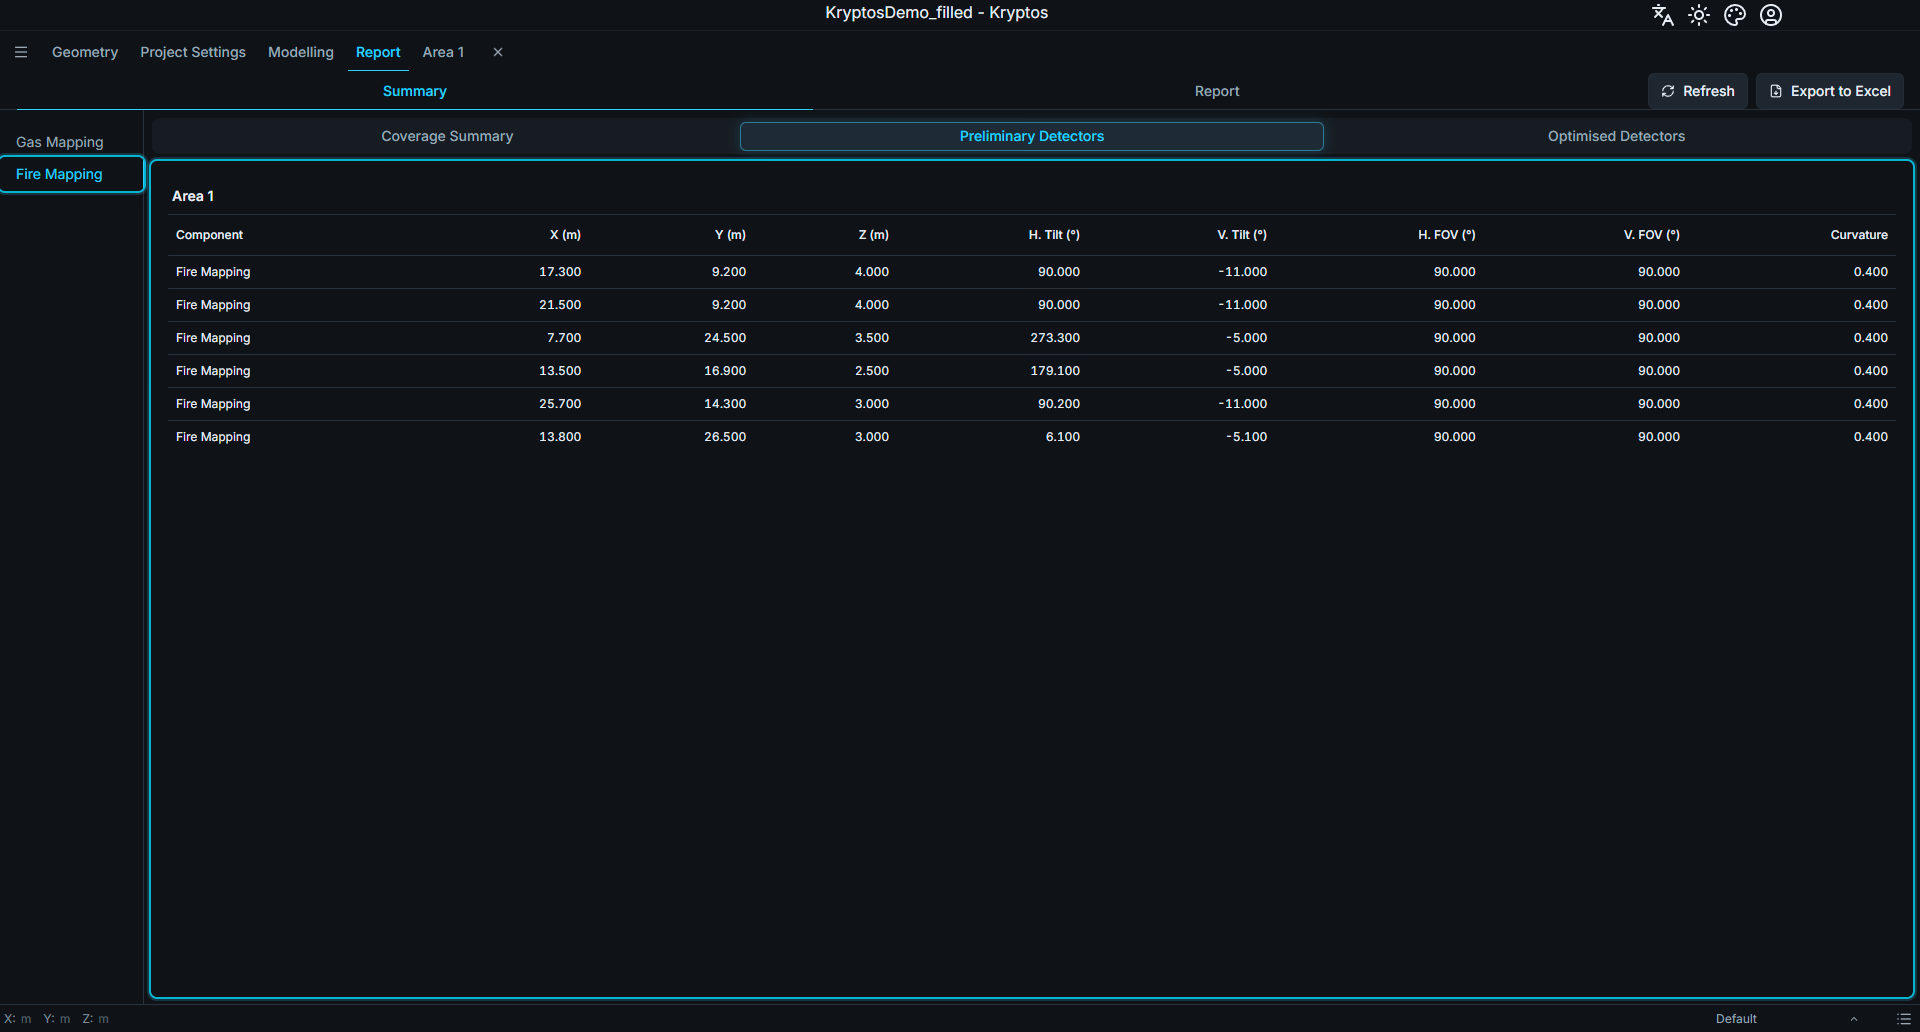
Exporting to Excel
Click Export to Excel (item 4 in the first image) and choose the location where you want to save the workbook.
The exported workbook contains the complete project summary, including:
- Coverage results for Preliminary and Final configurations.
- Preliminary detector lists.
- Optimised detector lists.
- Data for both Gas Mapping and Fire Mapping.
- Results across all areas in the project.
The export includes the entire project summary, not just the mapping type or sub-tab currently displayed.
TIP
The Coverage Summary is updated automatically when calculation results change.
If the displayed information appears out of date, click Refresh, located next to Export to Excel, to update the summary.
Report
The Report sub-tab builds a Word document (.docx) that describes your areas, their detectors and the coverage they reach. You choose what goes in it, and Kryptos writes it for you.
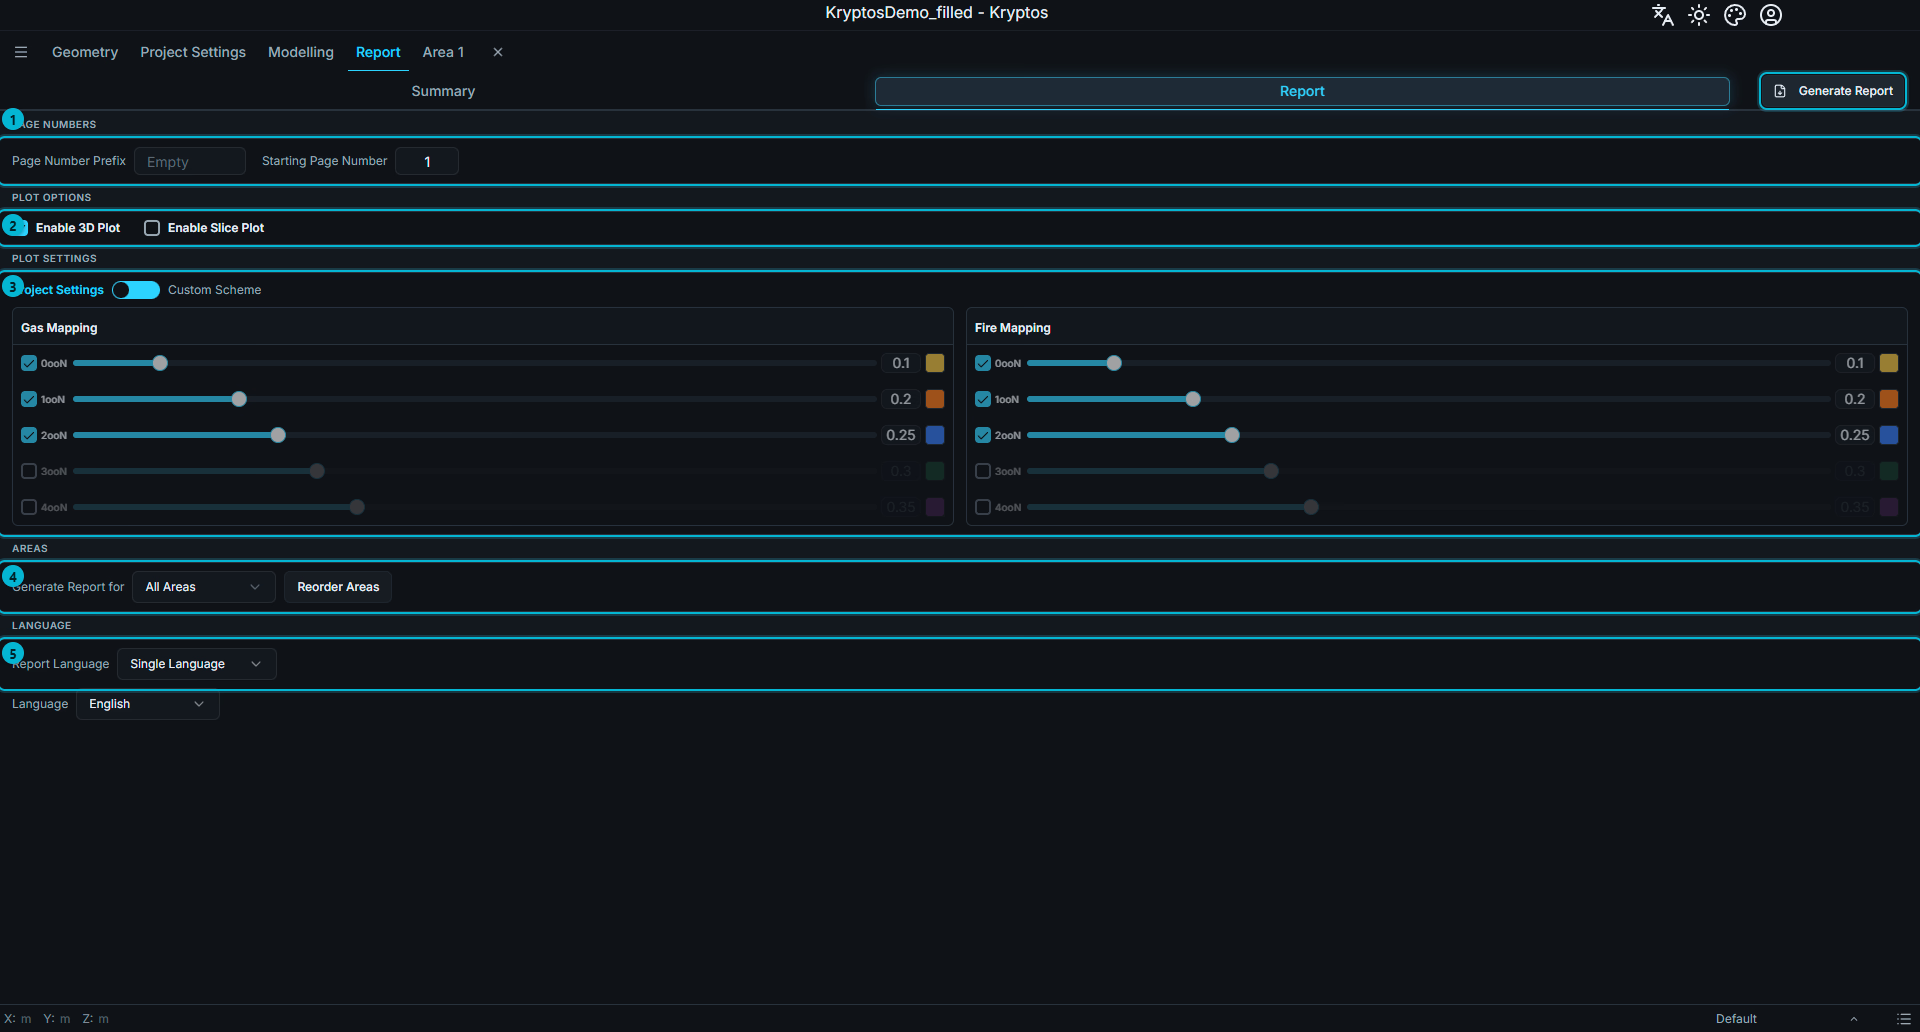
The page has these sections, from top to bottom. The Generate Report button is at the top right of the tab.
- Page Numbers — how the pages of the report are numbered.
- Plot Options — whether the report includes 3D plots and slice plots.
- Plot Settings — the colours, transparency and slice planes the plots use.
- Areas — which areas are in the report, and in what order.
- Language — the language of the report, or two languages side by side.
What is in the Report
For every area you choose, the report contains the following.
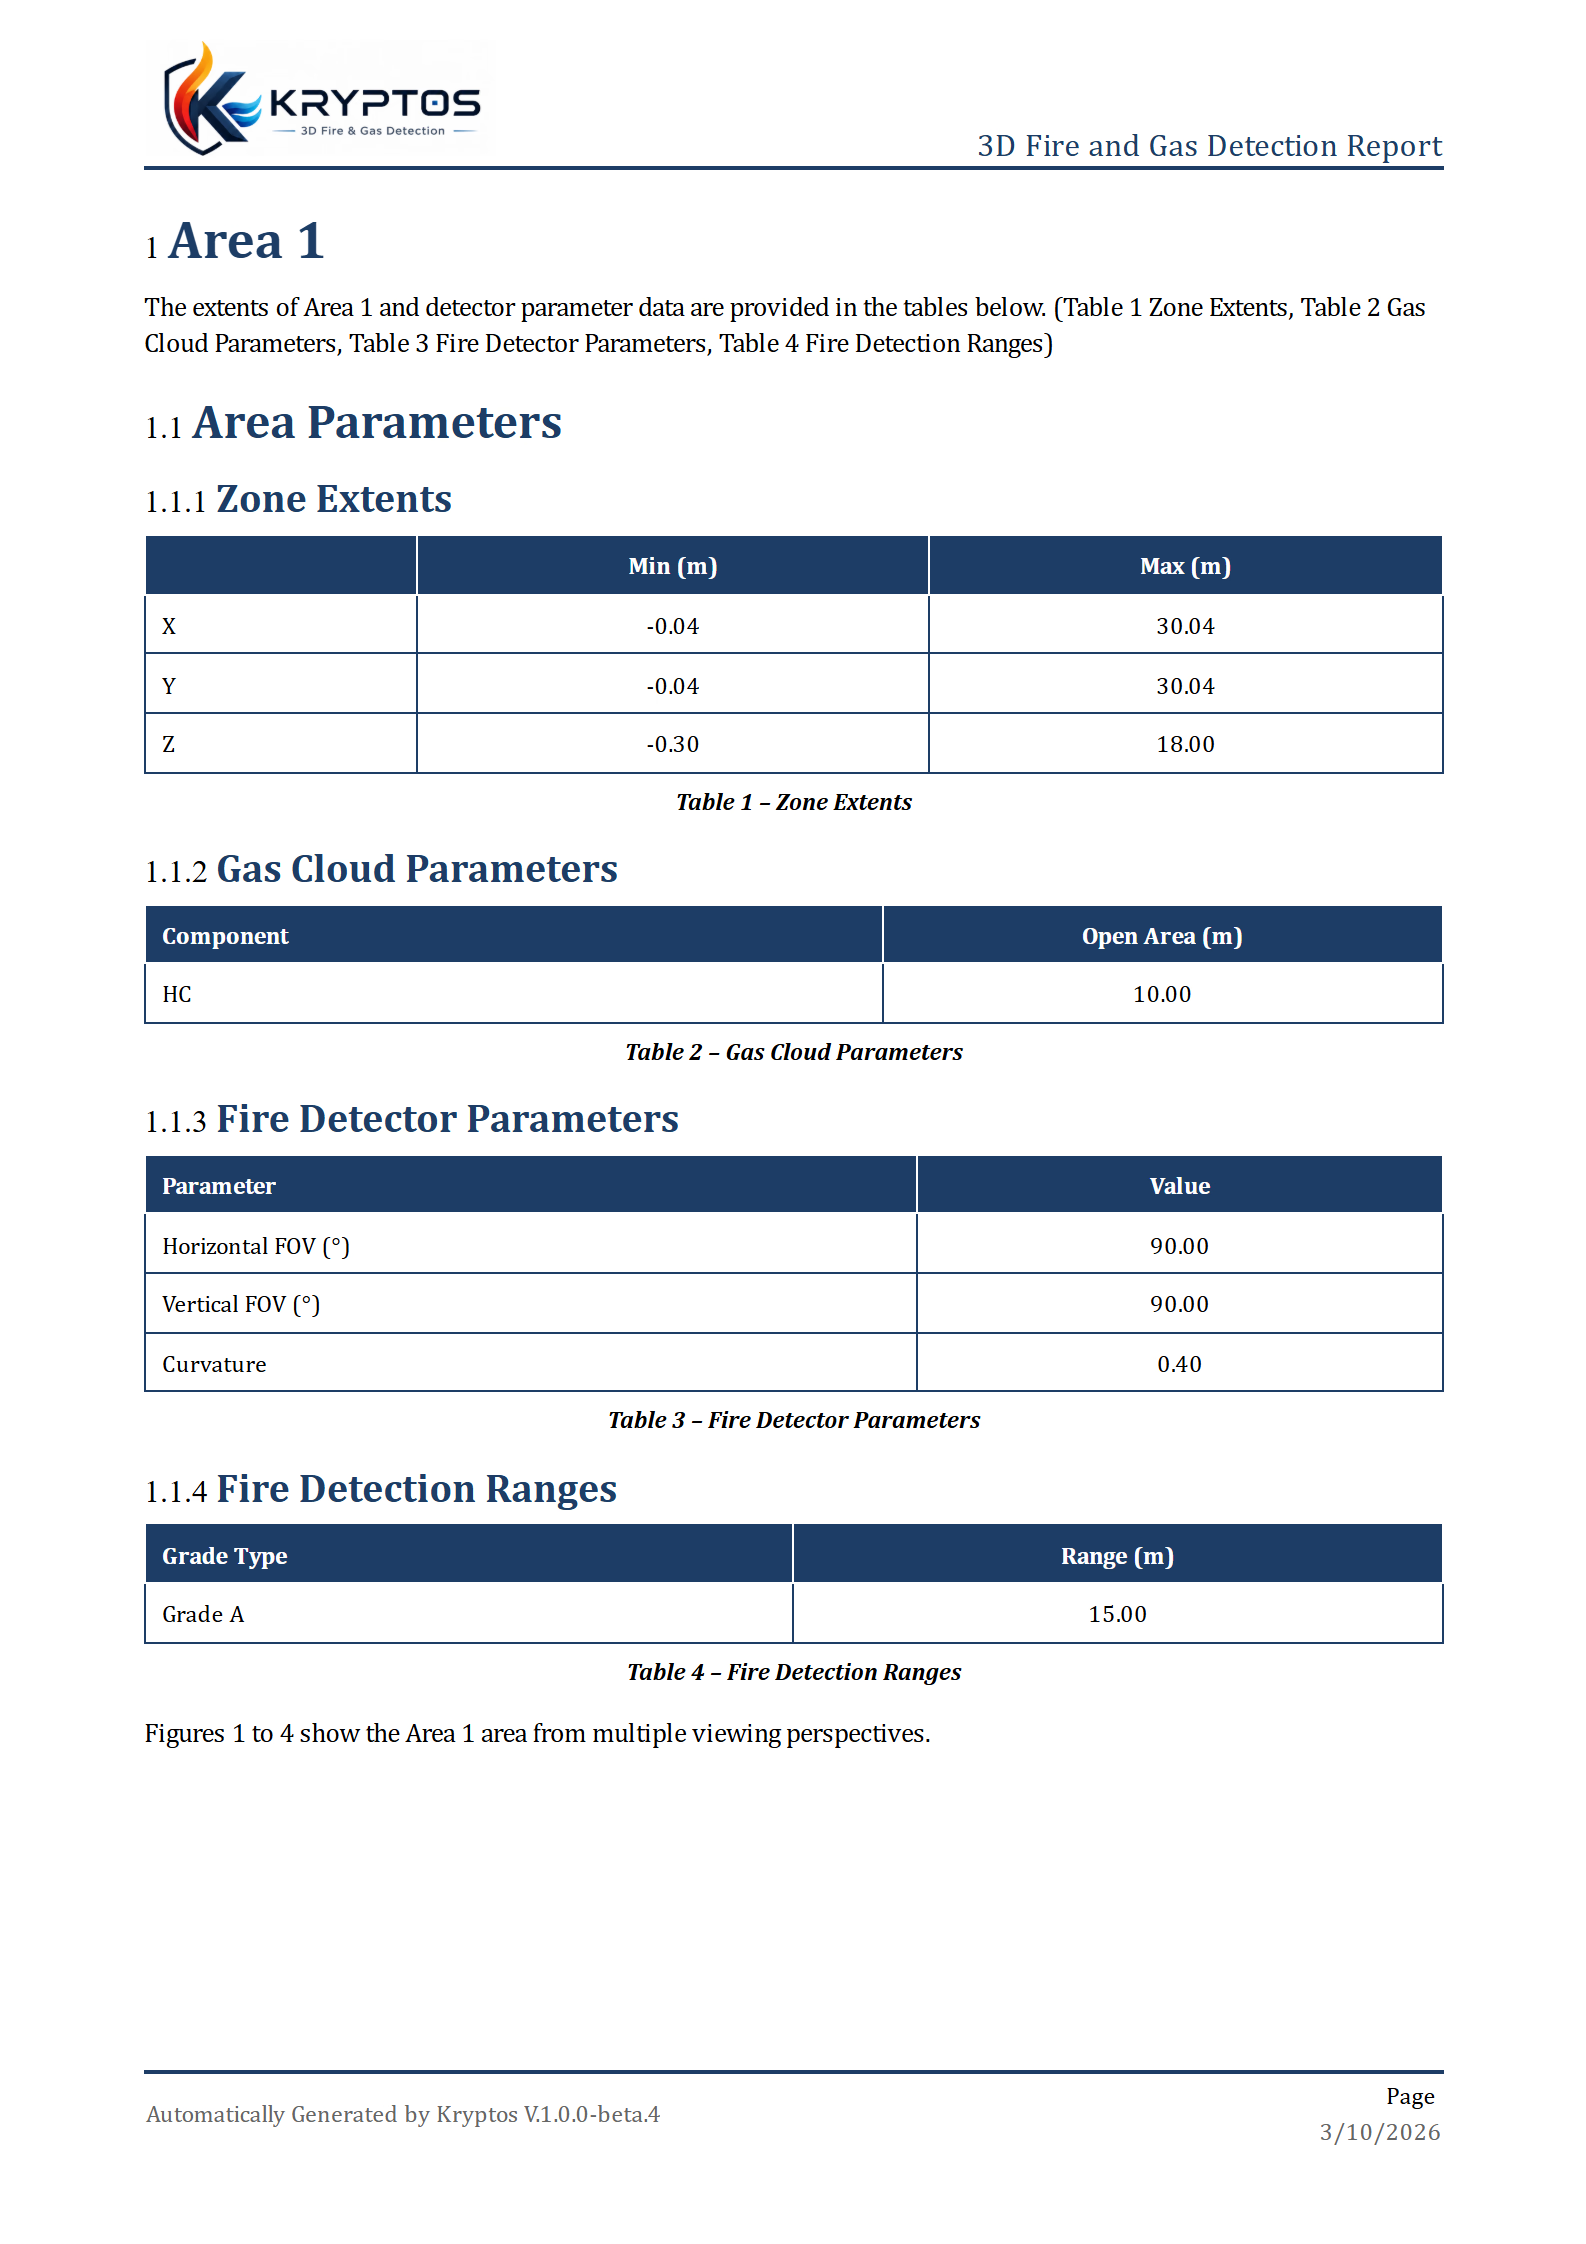
- The area — its name, a table of its size on each axis (Zone Extents) and four pictures of the area from different angles.
- Gas and fire settings of the area — the gas cloud sizes for each component, and for fire the detector, its field of view and its detection ranges. A part is only shown when the area uses it.
- Each mapping, starting on a new page — the grades you defined for it, followed by its Preliminary Configuration and its Final Configuration.
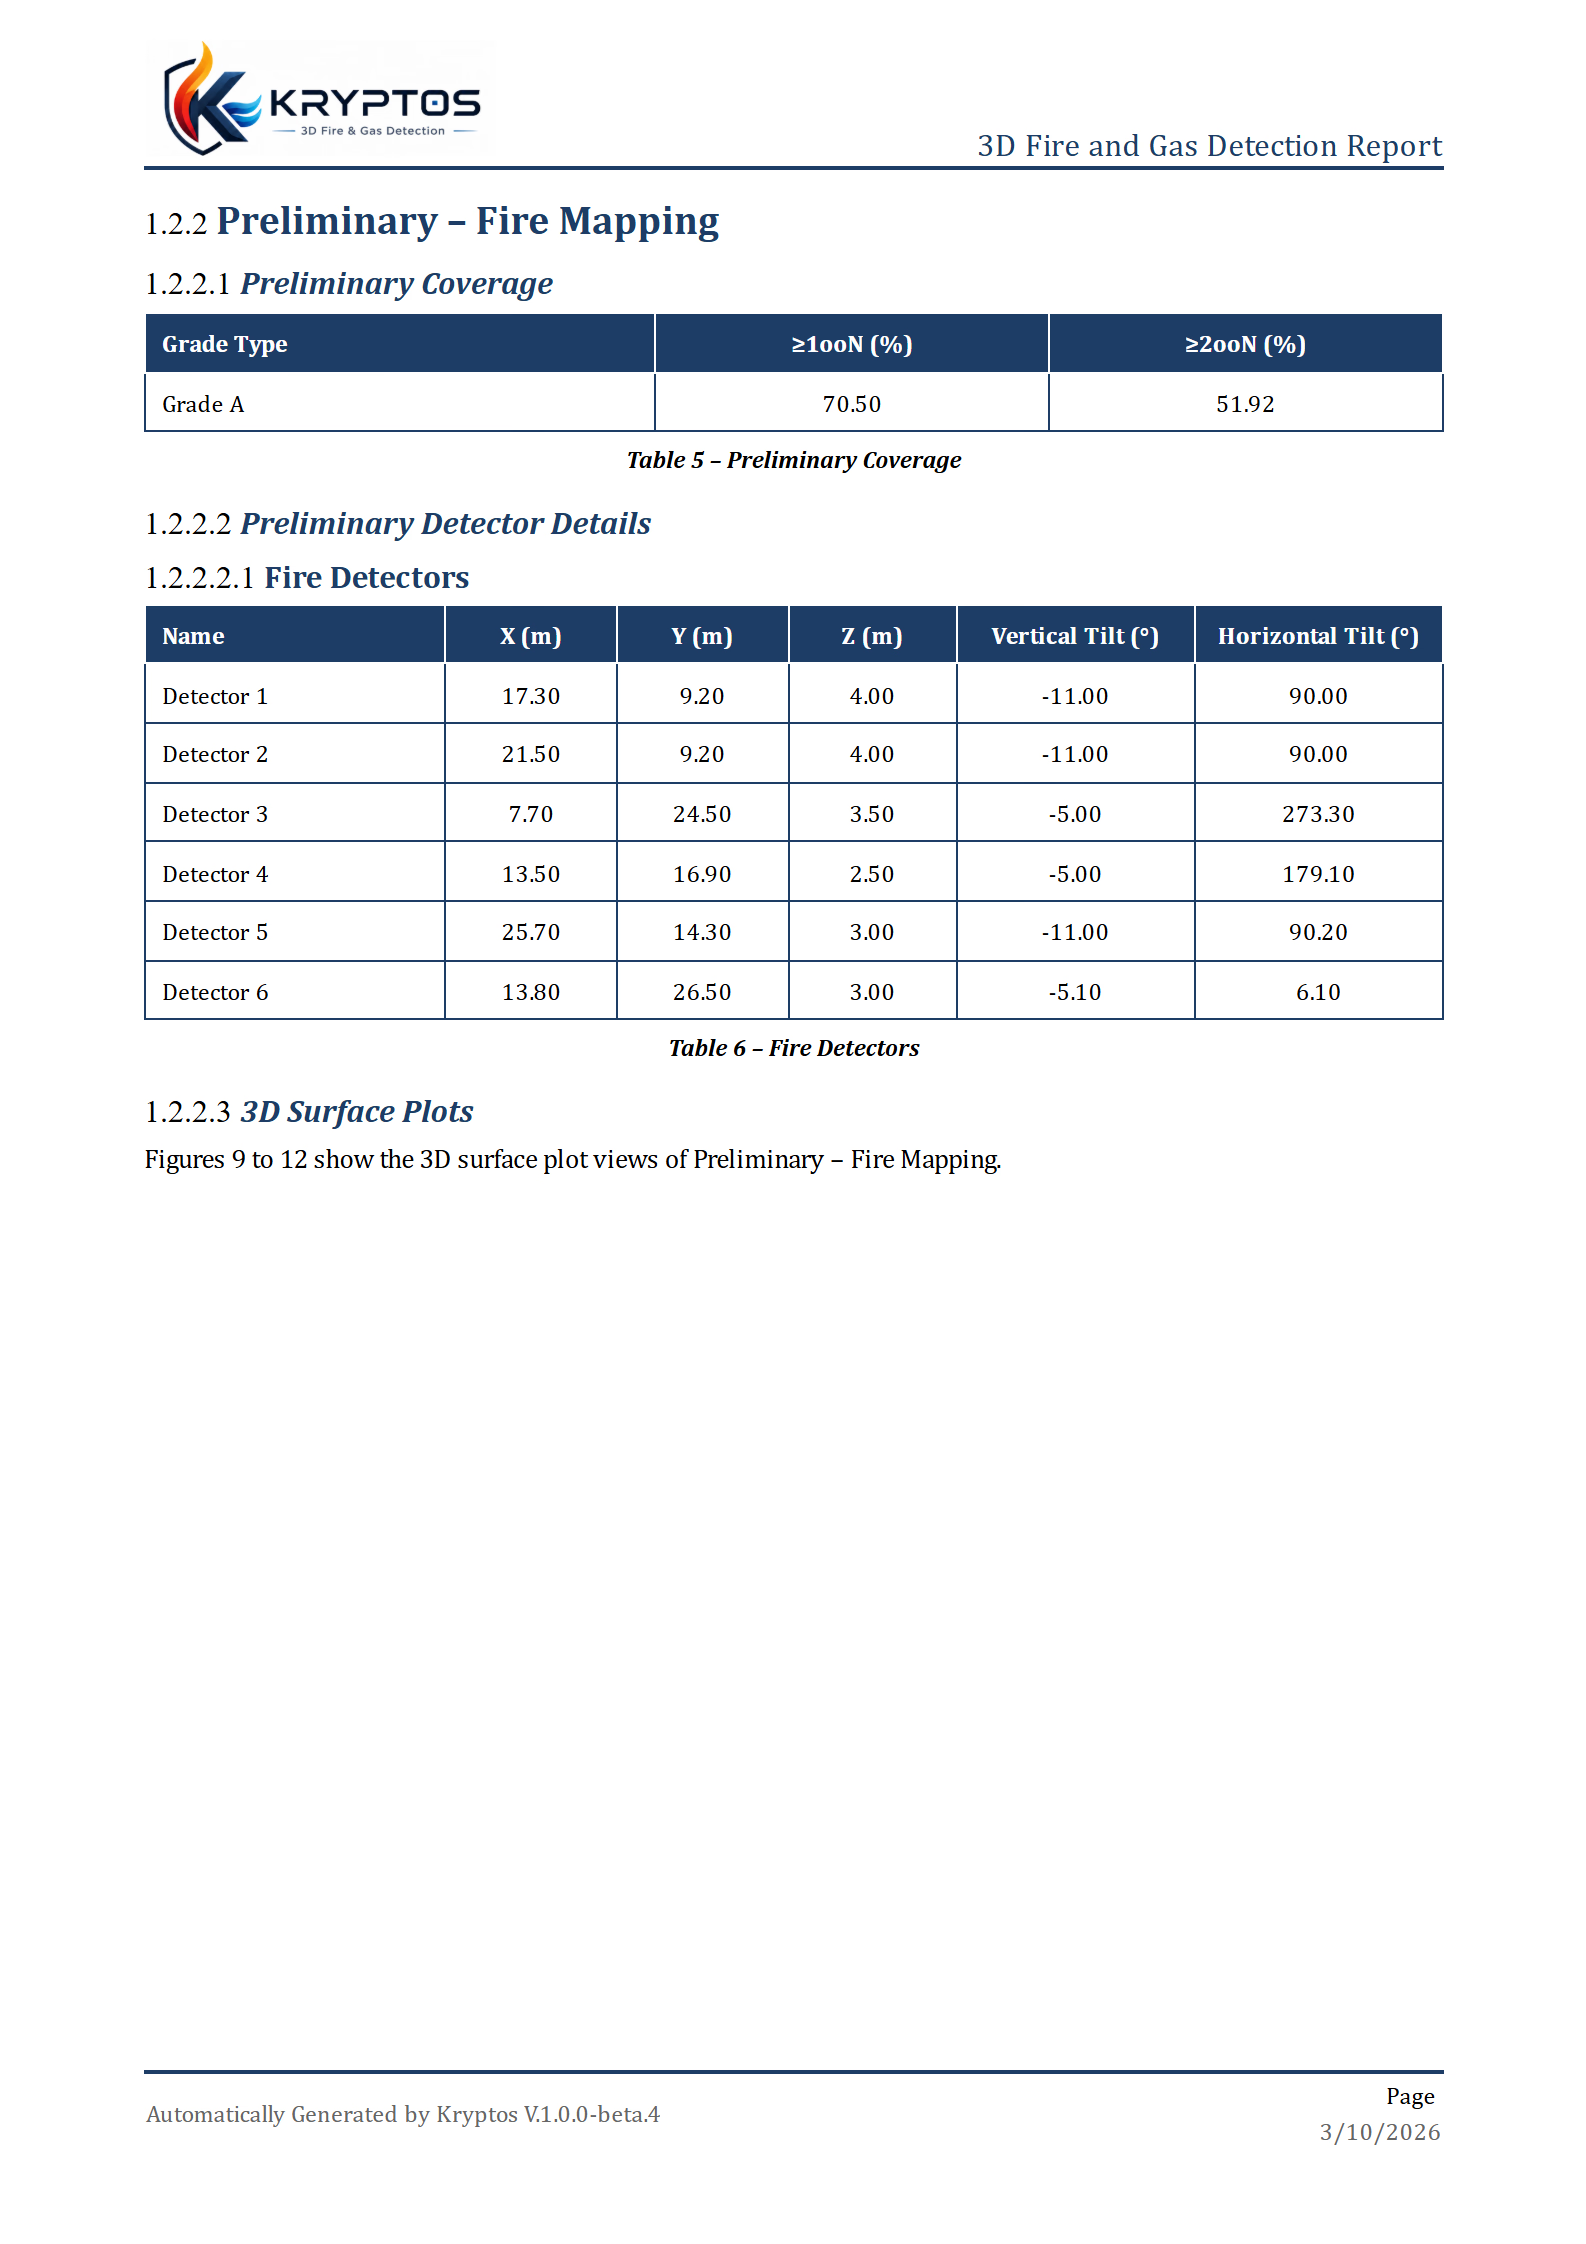
For each Preliminary Configuration and Final Configuration, the report shows:
- Coverage — a table of the coverage reached.
- Detector Details — the detectors that were placed, grouped as fire detectors, point gas detectors and open path gas detectors.
- Pictures of each grade — how that grade is spread out in the area.
- 3D Surface Plots — when you switch them on.
- 2D Slice Plots — when you switch them on, one set for each plane you pick.
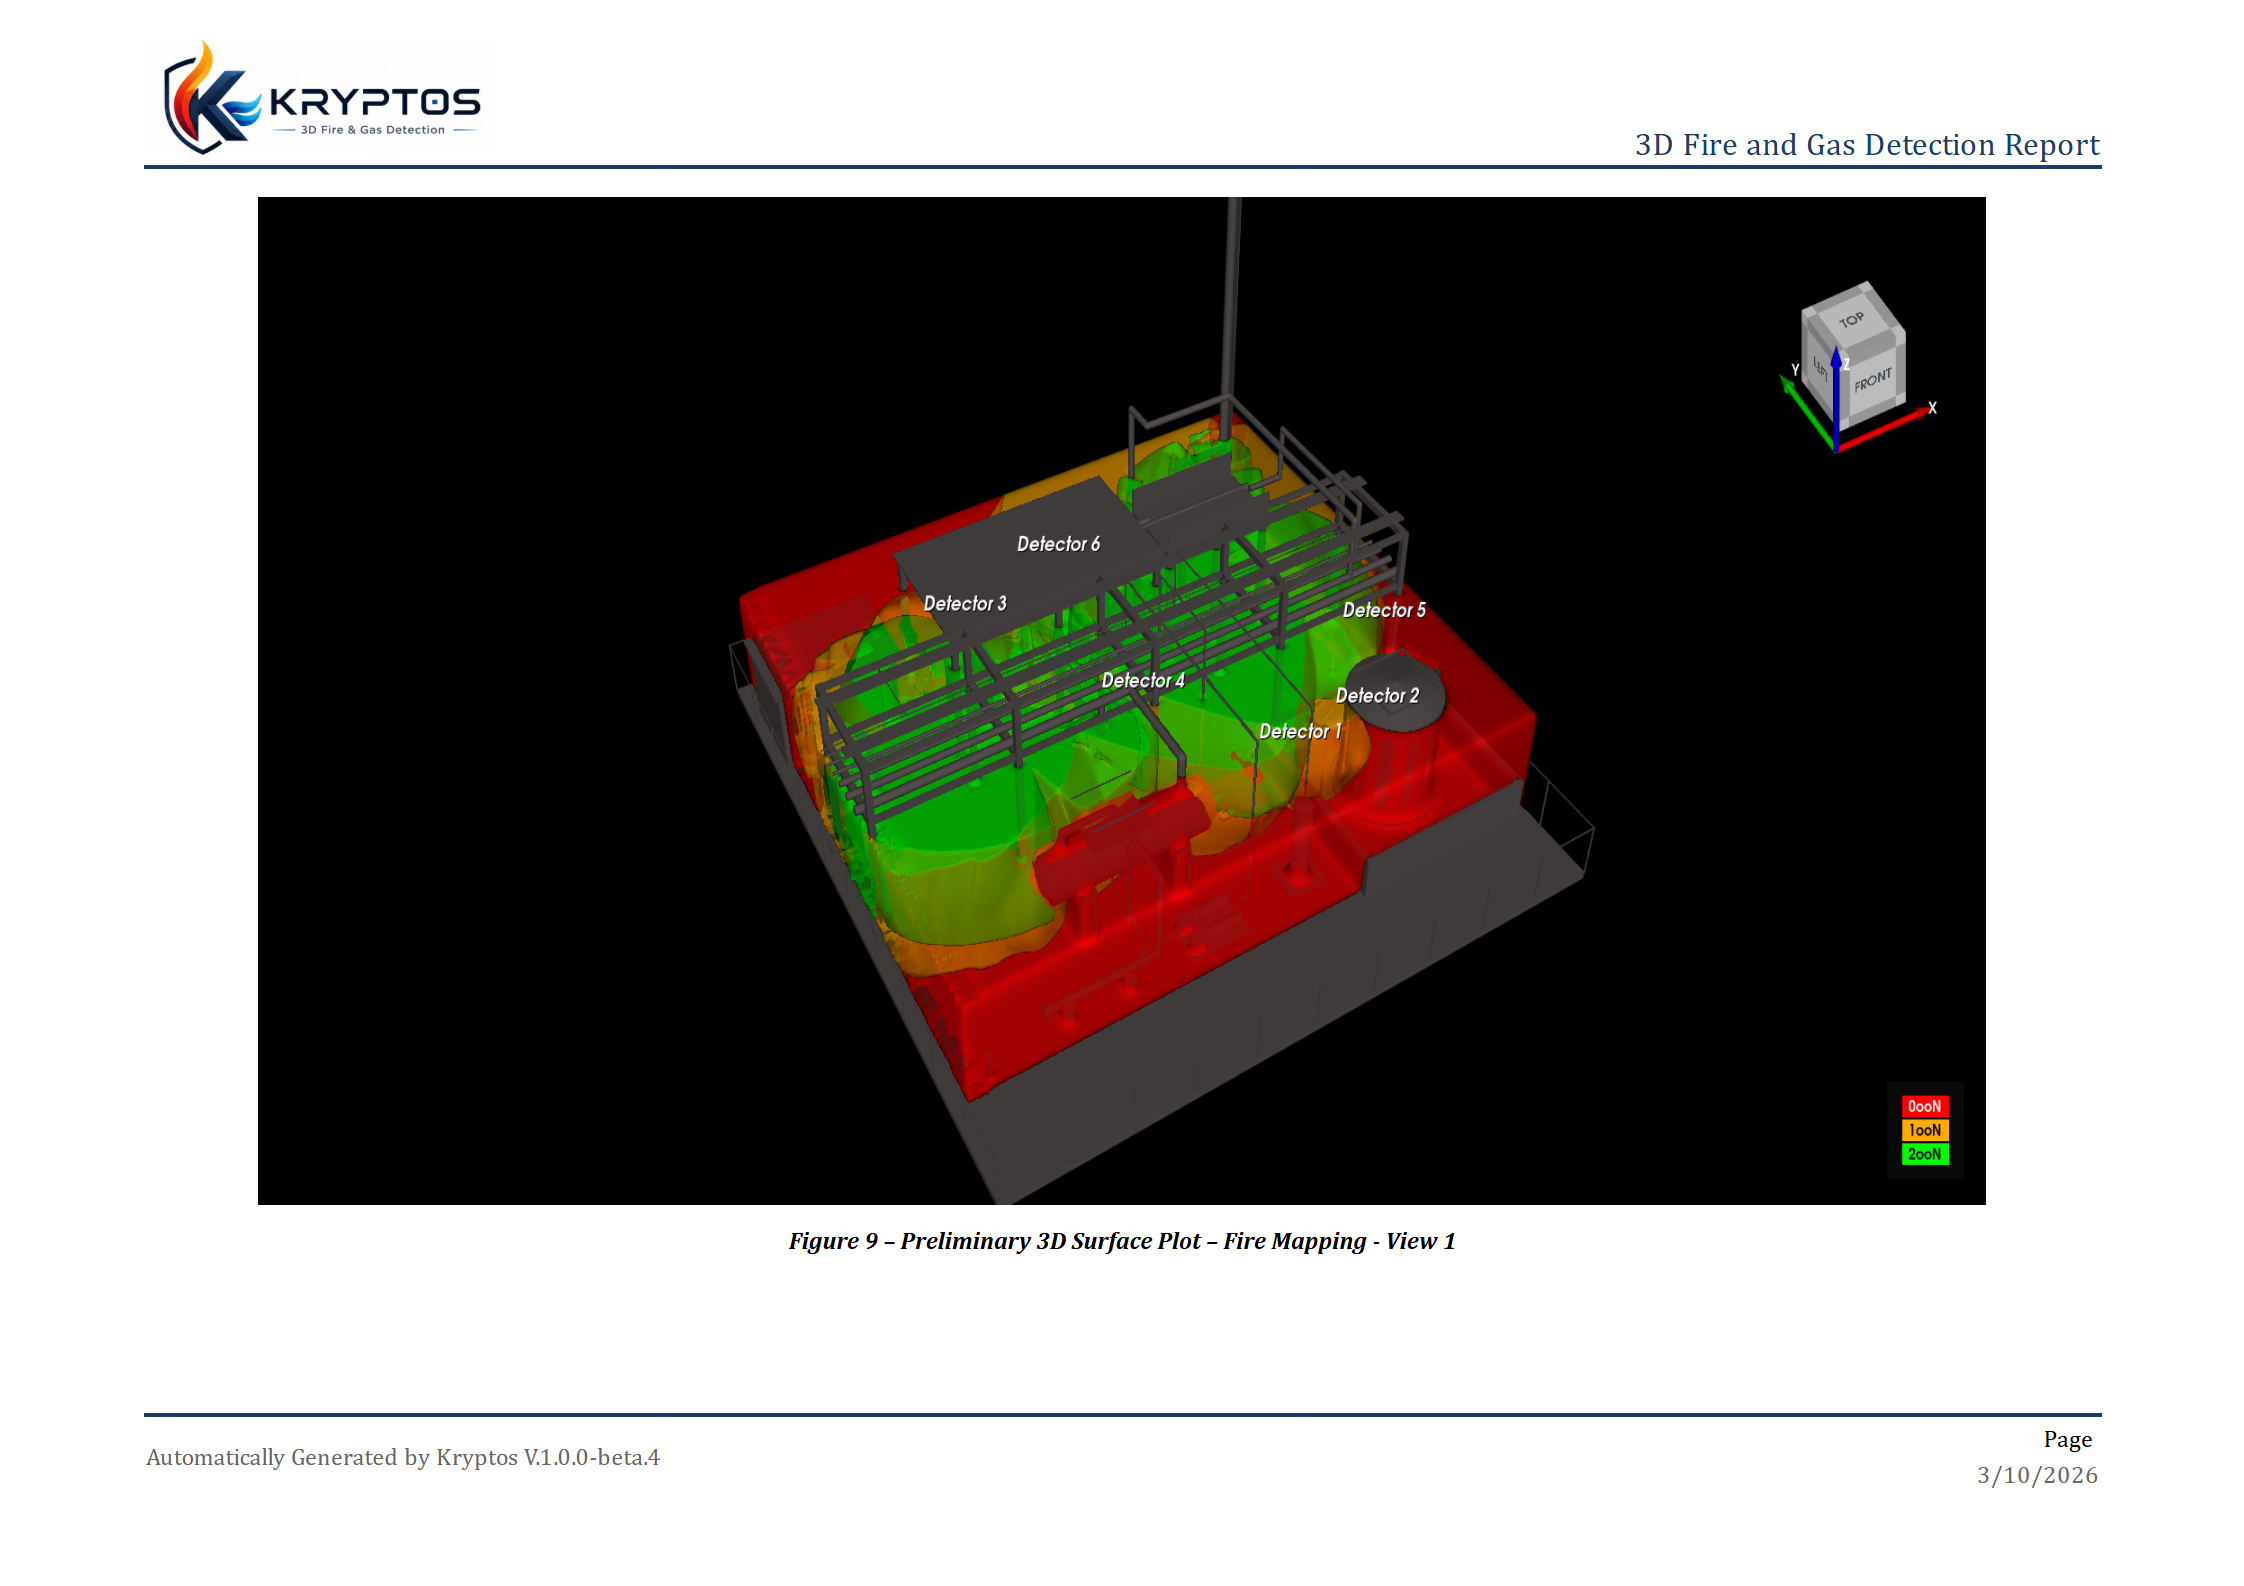
Tables and pictures are numbered automatically, and the text that introduces each group of pictures refers to the right numbers.
WARNING
The report uses the Preliminary and Final configurations. If a mapping has no configuration, its section says No configuration exists for this mapping. Set both configurations for every mapping, and calculate them, before you generate the report. See Before You Start.
Every page has a header with the report title and the logo, and a footer with the Kryptos version, the date and the page number. If your licence puts a watermark on your work (for example TRIAL MODE), the same watermark appears on every page of the report. See Licensing Modes.
Page Numbers
- Page Number Prefix — text placed in front of every page number, such as an appendix letter. Leave it empty for plain numbers.
- Starting Page Number — the number of the first page. It starts at 1. Use a higher number when the report continues a bigger document.
For example, a prefix of A- and a starting number of 5 gives page numbers A-5, A-6, A-7, and so on.
Plot Options
- Enable 3D Plot — adds the 3D surface plots to the report.
- Enable Slice Plot — adds the slice plots, which are flat cuts through the area along a plane.
Both are off by default. Plots make the report longer and take more time to create, so switch on only the ones you need.
Plot Settings
Plot Settings decide how the plots look. It starts with a switch between two colour choices.
- Project Settings — the plots use the colours you set for each voting level in Project Settings. The report always matches what you see in the model. These colours cannot be changed here.
- Custom Scheme — you choose the colours for the report only. Nothing changes in your model or in Project Settings. When you switch to Custom Scheme, you start from the project colours, so nothing is blank.
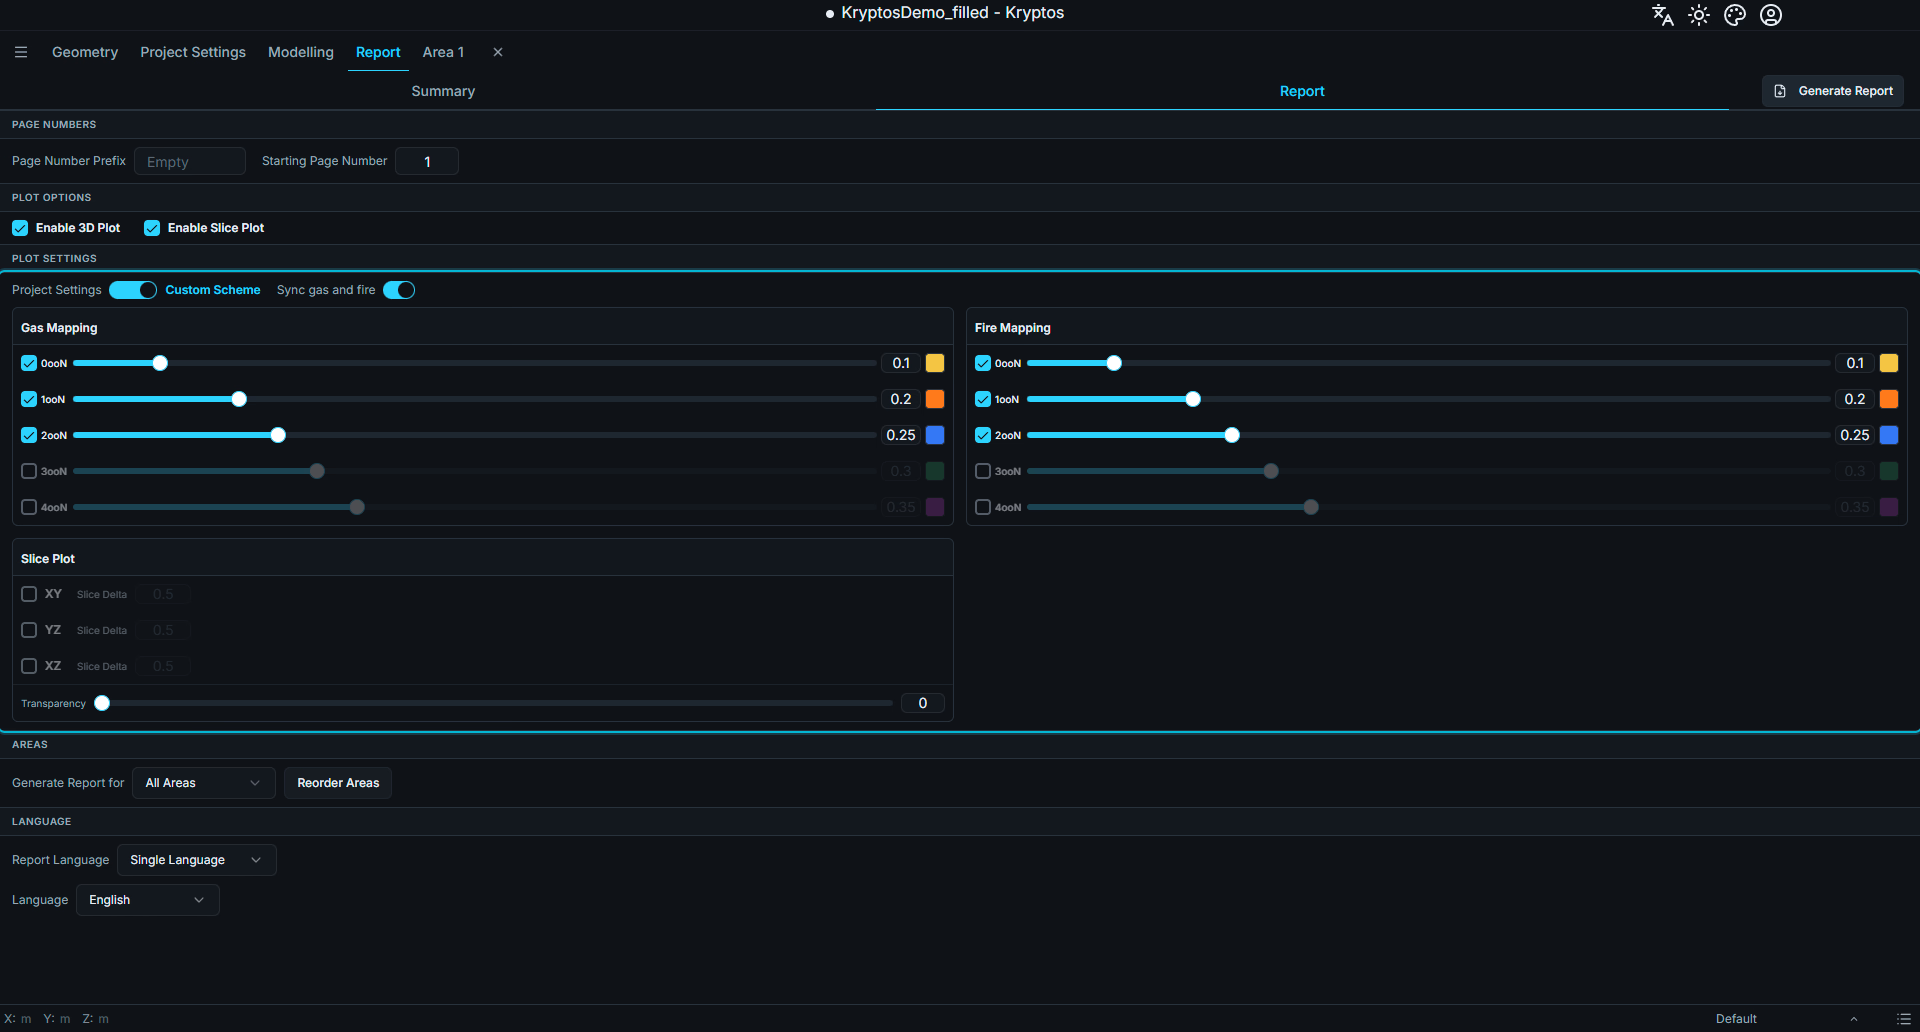
With Custom Scheme, there is one card for Gas Mapping and one for Fire Mapping. Each card has a row for every voting level (0ooN to 4ooN). In each row you can:
- tick or untick the level, to show it or hide it in the plots;
- click the colour box to pick a colour;
- move the transparency slider, or type a value between 0 and 1. A higher value makes that level easier to see through, so the parts behind it show.
Sync gas and fire appears with Custom Scheme. When it is on, a change you make for gas is made for fire too, and the other way round. Switch it off when you want different colours for the two.
When Enable Slice Plot is on, a Slice Plot card also appears.
- Tick the planes you want: XY, YZ and XZ.
- Slice Delta — the distance between two slices, for each plane. A bigger number gives fewer slice plots, and a smaller number gives more. The smallest value is 0.01. The default is 0.5.
- Transparency — how see-through the slice plots are.
TIP
A small Slice Delta on a tall area can create hundreds of plots, which makes the report slow to create and very long. Start with a larger value and make it smaller only when you need more detail.
Areas
- Generate Report for — choose All Areas, or Custom Areas to pick some of them. With Custom Areas, open the list and tick the areas you want.
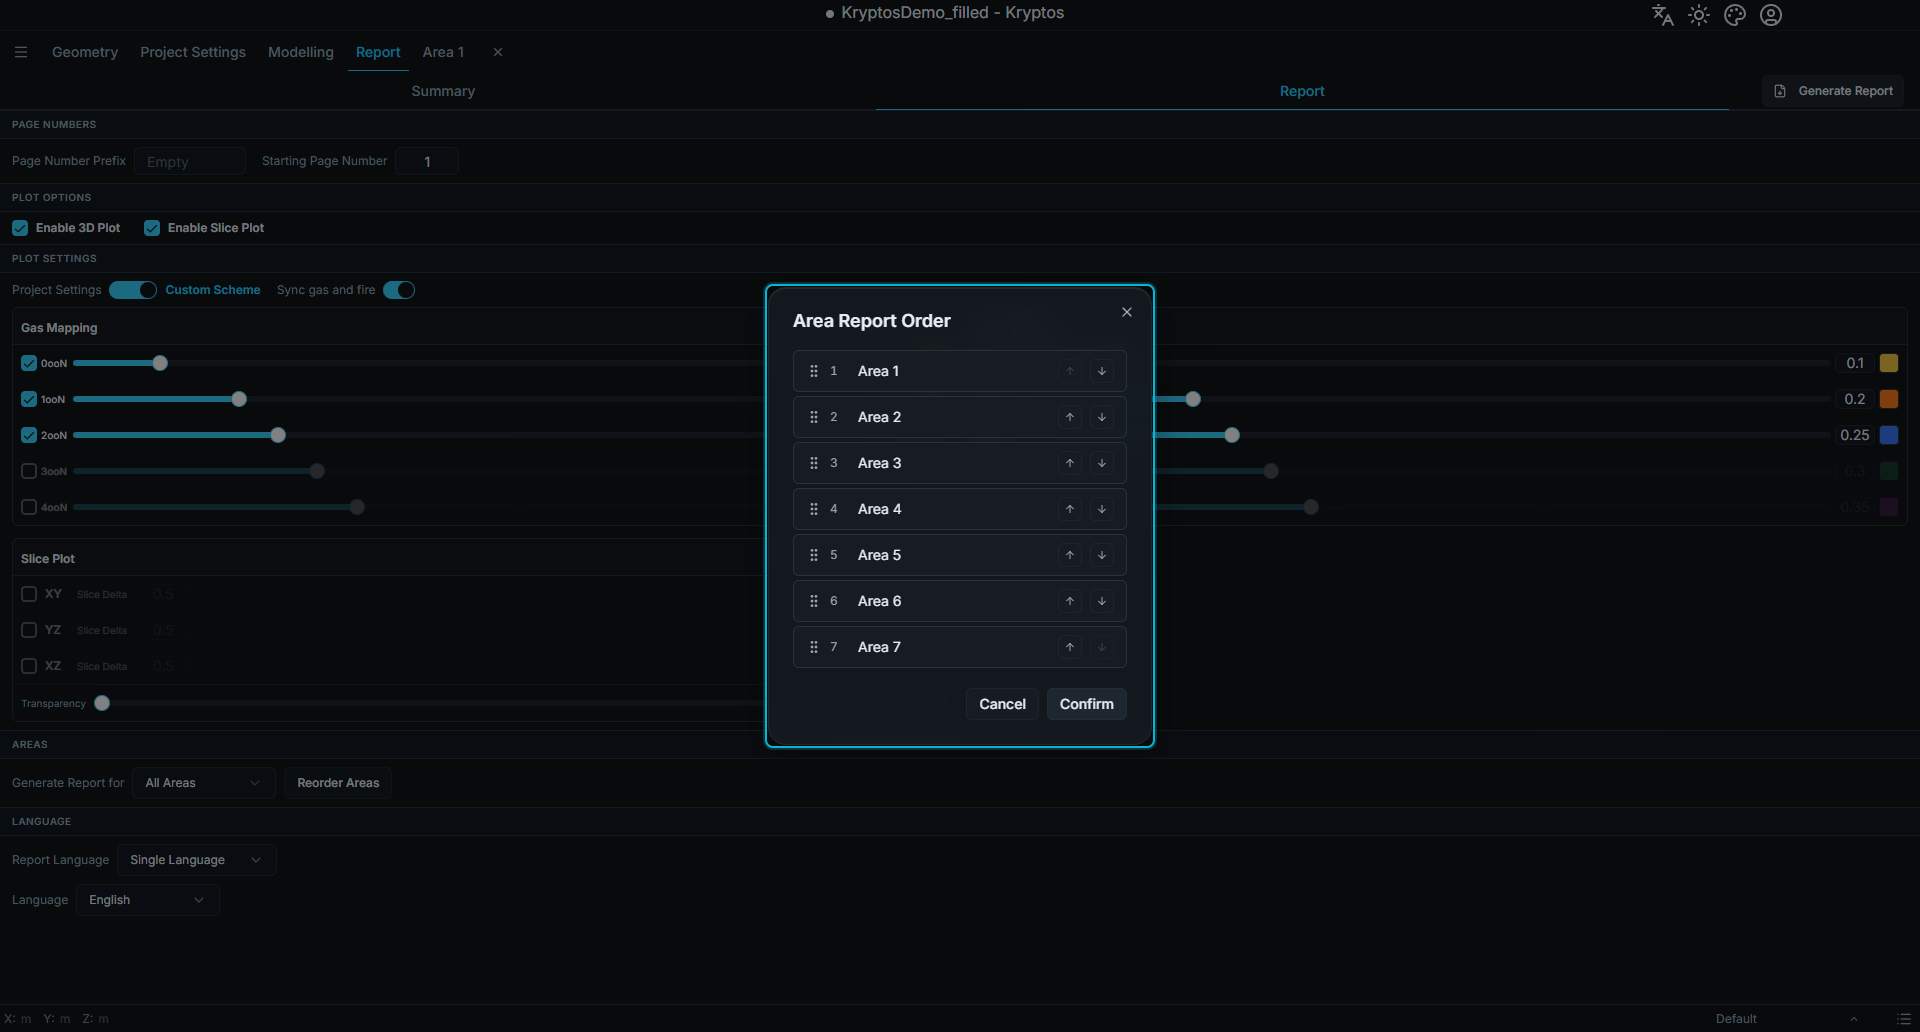
- Reorder Areas — opens a window where you set the order of the areas in the report. Drag the areas into the order you want, then click Confirm. Click Cancel to keep the old order.
Language
Kryptos can write the report in any of the 31 languages it supports.
- Single Language — the whole report is in one language. It starts with the language you use in Kryptos. Choose another one from the Language list if you need it.
- Multi Language — the report has two languages in the same document. Choose Language 1 and Language 2. Each paragraph and table heading is written in both languages, one after the other, so one document serves readers of both languages.
Languages that are written from right to left, such as Arabic and Hebrew, are laid out from right to left.
TIP
The language of the report does not change the language of Kryptos itself.
Generating the Report
- Check that the areas you need are calculated.
- Set the options above.
- Click Generate Report.
- Choose where to save the file. The suggested name is
Kryptos_Report.docx. - Wait while Kryptos works. A Generating Report window shows the area it is on, for example Area 2 (2/4), and a progress bar.
- When it finishes, a message says Report saved successfully. Open the file in Word.
Kryptos creates the pictures from the 3D view, so please leave the window as it is while the report is being made.
WARNING
If the file is already open in Word or another program, Kryptos cannot replace it and shows a message with the file name. Close the file and click Generate Report again.
If Something Goes Wrong
| Message | What it means | What to do |
|---|---|---|
| No areas found in this project. | The project has no areas. | Create an area first. |
| One or more areas have not been calculated. | An area in the report has no results yet. | Run the calculation for that area. See Running Calculations. |
| One or more mappings have not been calculated. | A mapping in the report has no results yet. | Calculate the mapping, then try again. |
| One or more configurations have not been calculated. | A Preliminary or Final Configuration has no results yet. | Calculate it, then try again. |
| Plot generation failed. | A plot could not be created. | Try again. If it keeps failing, switch off Enable 3D Plot or Enable Slice Plot to find which plot causes it. |
| Plot colours could not be saved. | Your Custom Scheme could not be stored. | Try again. |
Related
- Mapping — designating configurations as Preliminary or Final
- Running Calculations — calculating the configurations used to generate the project summary