Detector Contributions & Rankings
Detector Contribution shows how much each detector, in a configuration, contributes to the overall coverage. The contribution is expressed as a percentage and calculated separately for each voting logic.
You can sort the contribution table by any voting logic to rank the detectors. This helps identify which detectors contribute most to coverage and which provide relatively little benefit — useful information when reviewing and optimising a detector layout.
Before You Start
Detector contributions are calculated using the coverage results of a configuration. The configuration must therefore have been calculated before you can view its contributions.
For more information, see Running Calculations.
Opening Detector Contribution
Select a configuration in the area tree. The Detector Contribution button appears in the ribbon.
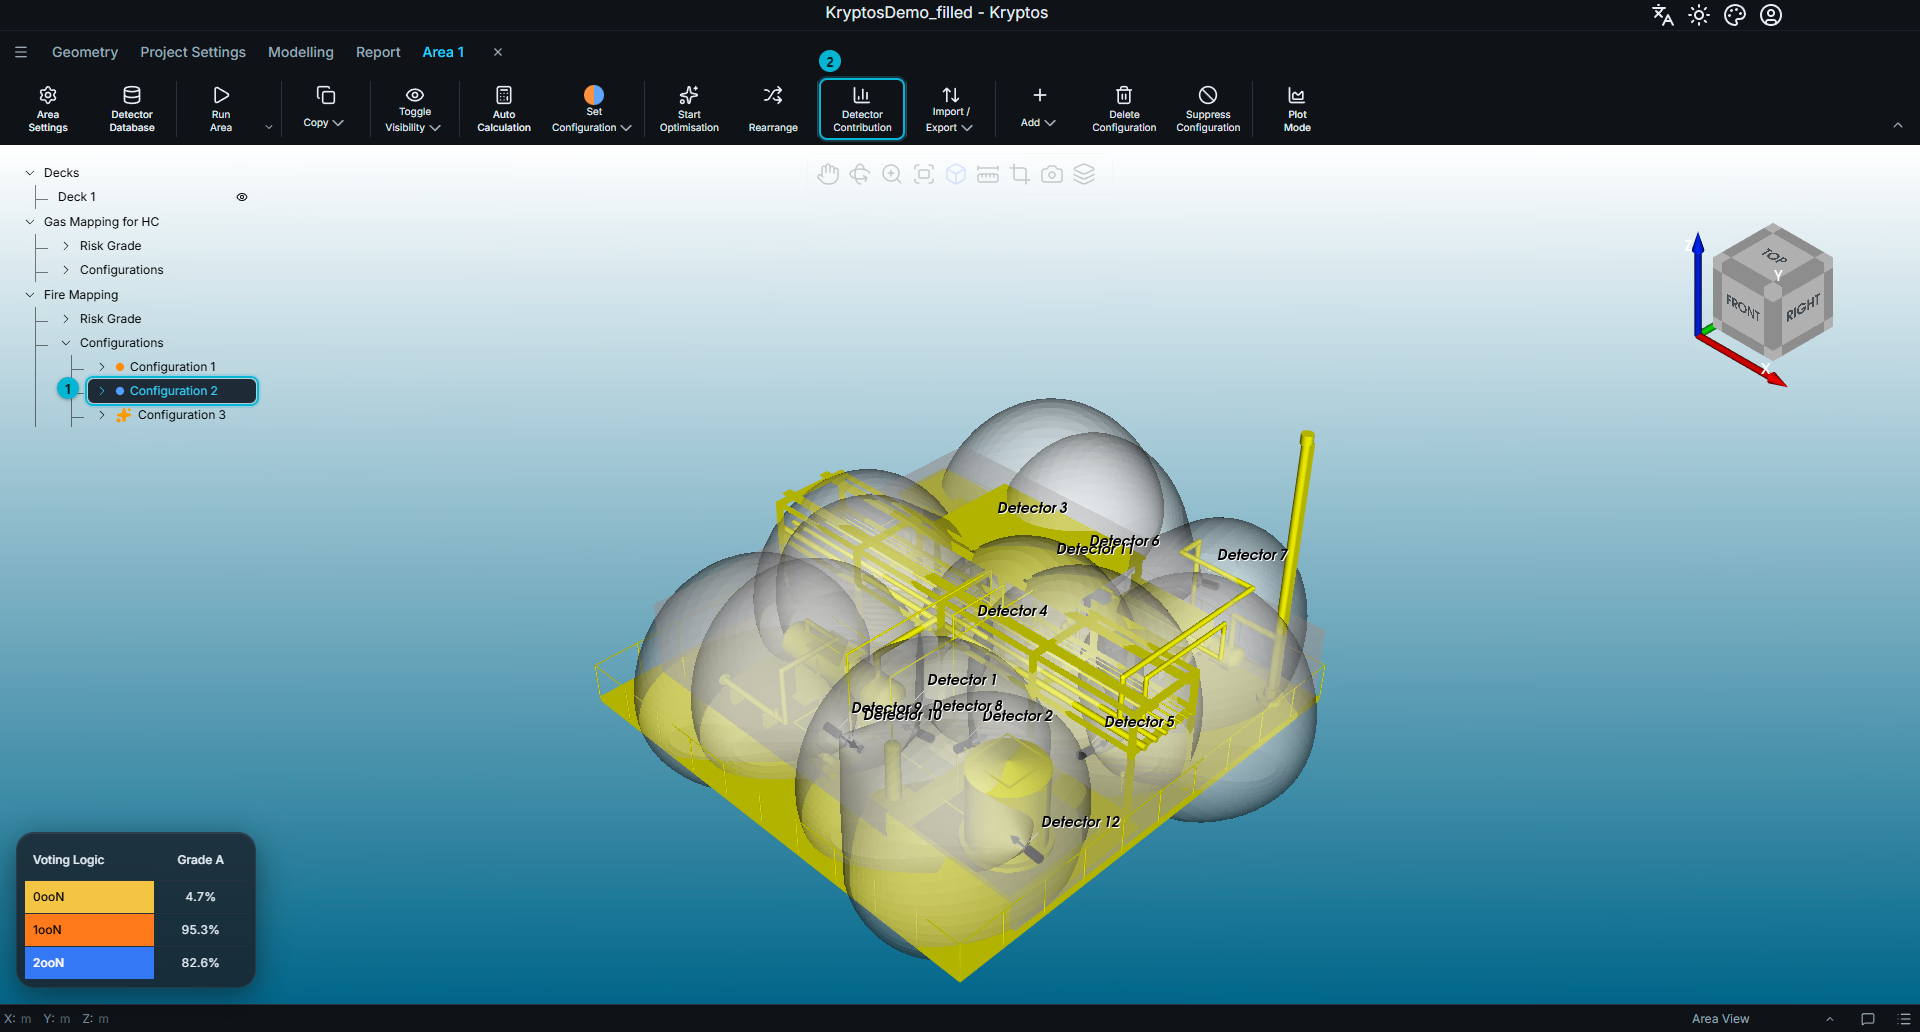
- Configuration — the configuration whose detector contributions you want to examine. In this example, Configuration 2 under Fire Mapping in Area 1 is selected.
- Detector Contribution — opens the contribution table for the selected configuration.
The Contribution Table
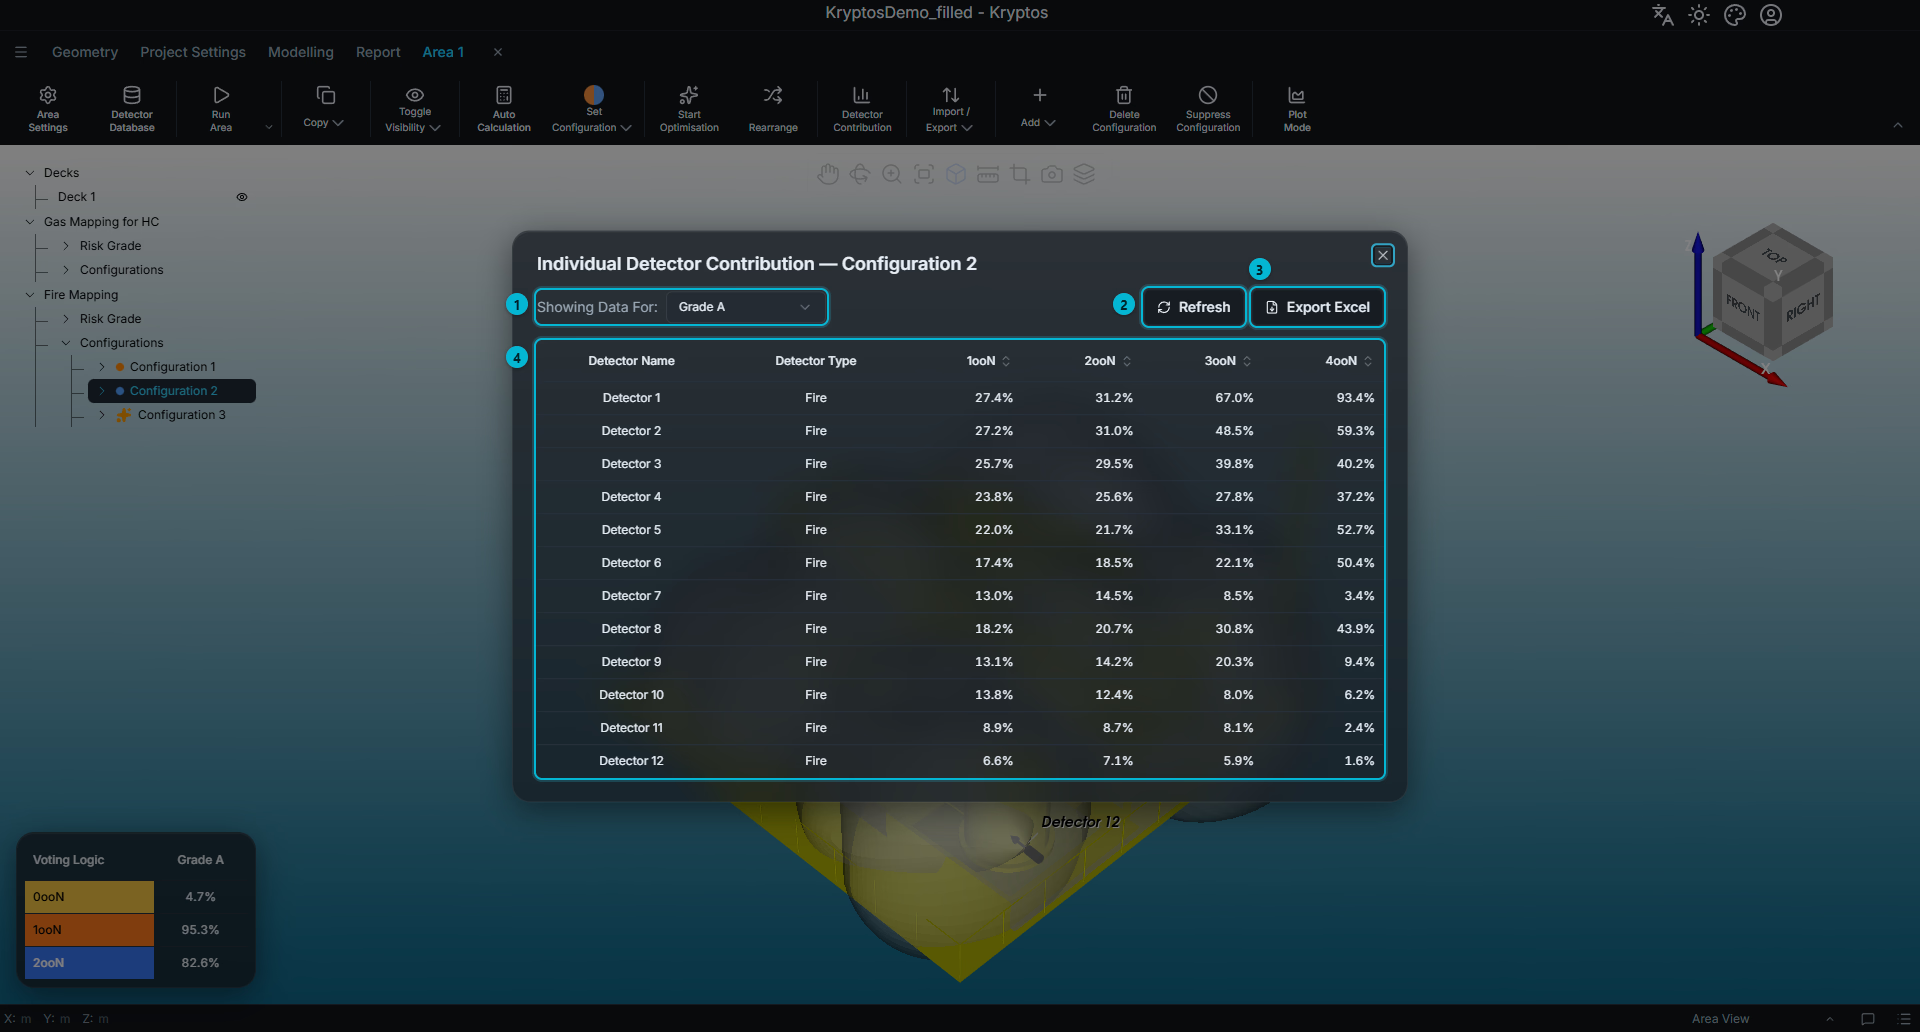
The contribution window provides the following controls and information:
- Grade — selects the grade for which detector contributions are displayed. Each grade has its own contribution results.
- Refresh — recalculates the detector contributions for the selected configuration.
- Export Excel — exports the contribution table to an Excel file.
- Table — displays the contribution of each detector at each voting logic, from 1ooN (coverage provided by at least one detector out of N) through to 4ooN.
TIP
If the table indicates that detector contributions have not been calculated, click Refresh.
If it indicates that the coverage calculations have not been performed, the mapping has not yet been calculated. Run the mapping first, then click Refresh to calculate the detector contributions.
Ranking Detectors
Click a voting logic column heading to sort the table by the contribution at that level.
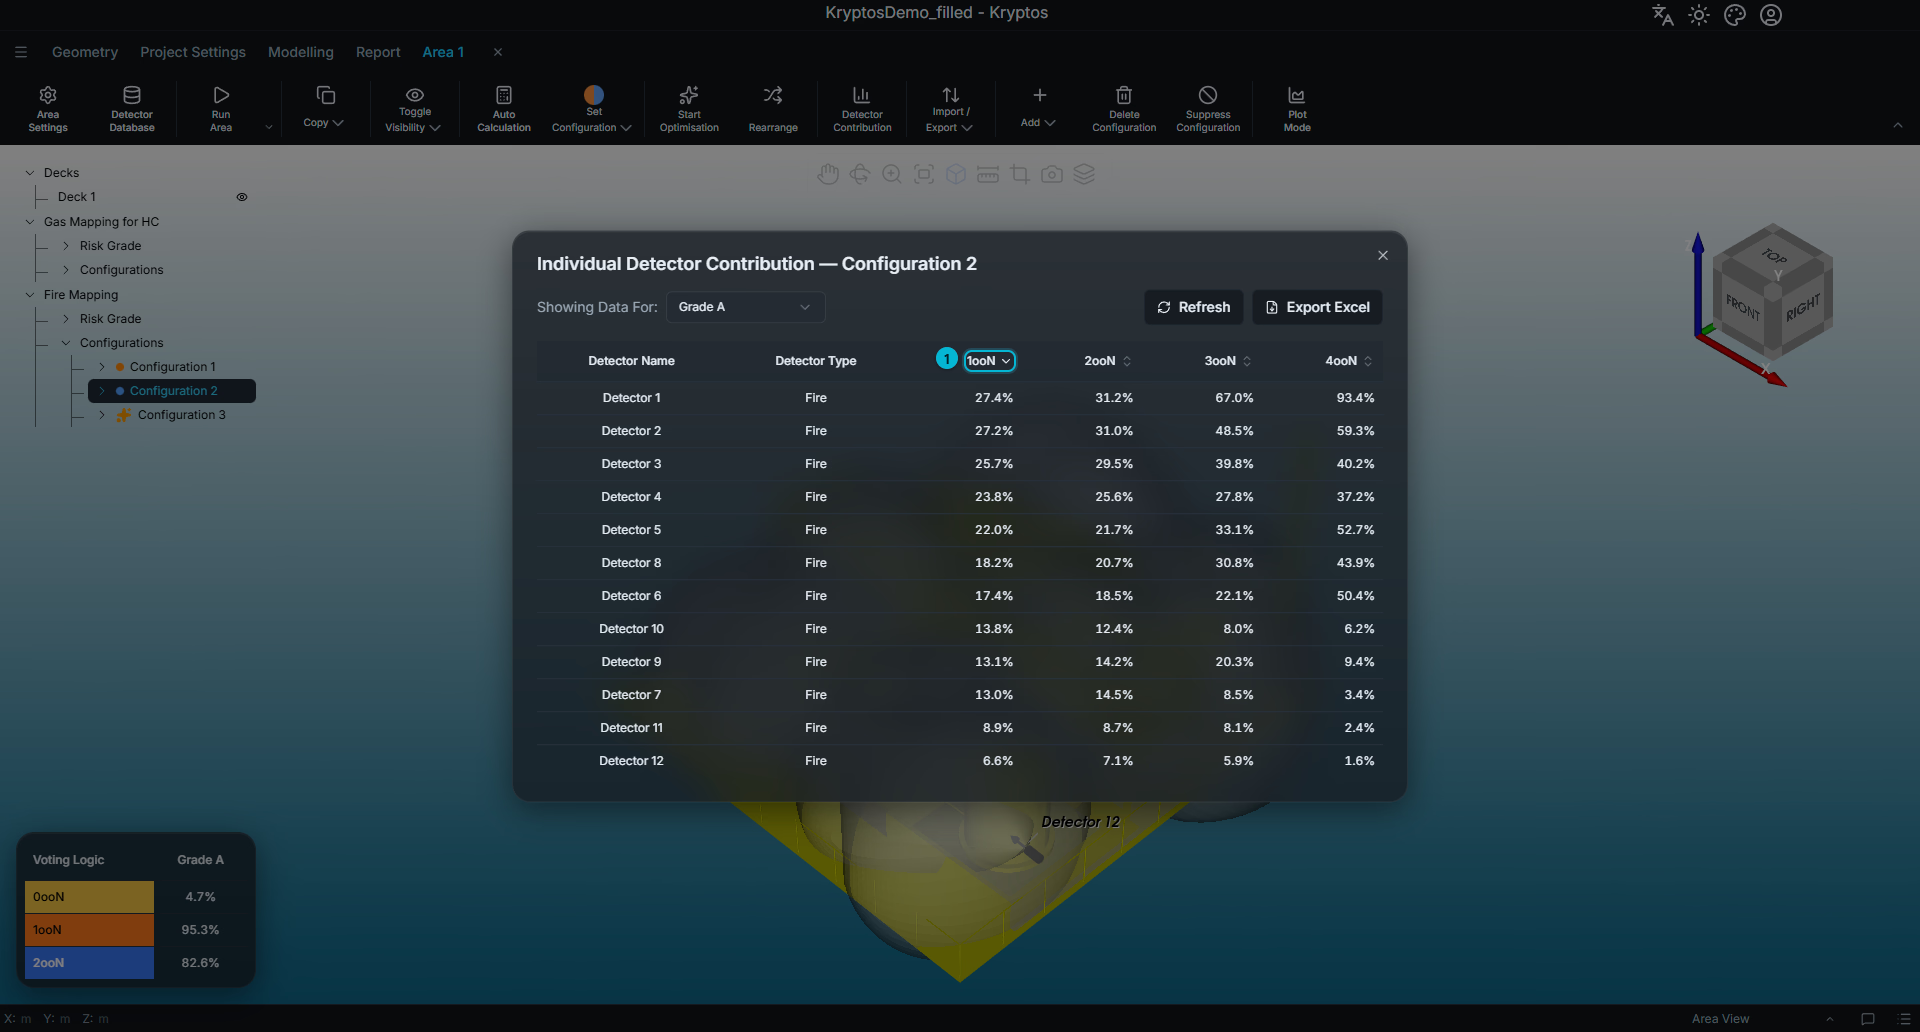
- 1ooN — in this example, the table is sorted by 1ooN contribution, with the highest contribution displayed first.
Each successive click on the same column heading changes the sort order:
| Clicks | Sort order |
|---|---|
| 1 | Largest contribution first |
| 2 | Smallest contribution first |
| 3 | Returns to the original order |
Choose the voting logic that corresponds to your coverage targets when reviewing the rankings.
Detectors near the top of the list make the greatest contribution at that voting level, while those near the bottom contribute relatively little. Detectors with low contributions may be candidates for relocation or removal during layout optimisation.
However, a low contribution at one voting level does not necessarily mean that a detector is unnecessary. Review its contribution across the other voting logics and consider the overall coverage requirements before modifying the layout.
Related
- Running Calculations — calculating a configuration before evaluating detector contributions
- Plot — 3D & Slice — visualising the coverage results in the 3D view